How COVID-19 made high-frequency data a go-to economic indicator
More than ever, economists are turning to alternative forms of data to help them understand the economy in real time.

Last year, COVID-19 changed the economy so fast that economists needed a different kind of data to help them understand it.
Monthly indicators based on government survey data that take weeks to collect and process proved too slow for analyzing the abrupt changes caused by the pandemic, so economists from academia to Wall Street to the Federal Reserve began tracking more timely data that measures economic activity in close to real time.
“What we think of as sort of nonstandard, high-frequency data, that’s become a very important thing,” said Federal Reserve Chairman Jerome Powell at a press conference in July.
What is high-frequency data?
High-frequency data is any kind of data available more frequently than typical monthly data, such as the jobs report from the Bureau of Labor Statistics or consumer spending from the Bureau of Economic Analysis.
“The concern about that in this crisis is that by the time you get the data, it’s stale,” Robert Kaplan, president of the Federal Reserve Bank of Dallas, told “Marketplace” host Kai Ryssdal in an interview in December. “So more than ever, we’ve gone to high-frequency data.”
Weekly reports on unemployment insurance claims from the Department of Labor and daily airline travel data from the Transportation Security Administration are examples of that, but other forms of high-frequency data coming from private companies rather than government agencies have become go-to pandemic indicators as well.
That includes measures of consumer spending based on credit and debit card transactions, workforce activity from payroll processing companies such as UKG, dining traffic data from the restaurant reservation company OpenTable, weekly hotel occupancy rates and other private-industry data available on a daily or weekly basis.
Because this data is collected as people clock in to work, go out to dinner or make purchases with credit cards, it offers economists real-time insights between monthly reports.
Let’s look at some examples
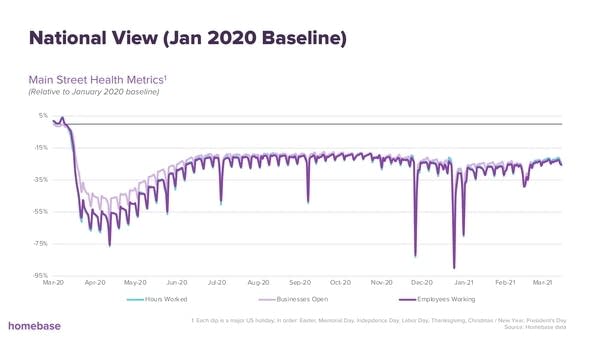
One previously untapped source of high-frequency data that’s gone into widespread use during the pandemic is data from a company called Homebase.
Homebase makes employee scheduling and time-tracking software for small businesses.
Last spring, economists at the Federal Reserve Bank of St. Louis used Homebase’s data to create an employment forecast that can “check the temperature of the labor market in real time.”

“We are literally the time clock that workers at these stores and Main Street businesses clock in and clock out of every day to get paid,” said Ray Sandza, Homebase’s vice president of data and analytics. “So since the pandemic began, we have about 76 million timecards across the country that can be sliced and diced by industry, ZIP code, [and] team size to get a sense of what’s happening.”
Another example comes straight from the phone in your pocket.
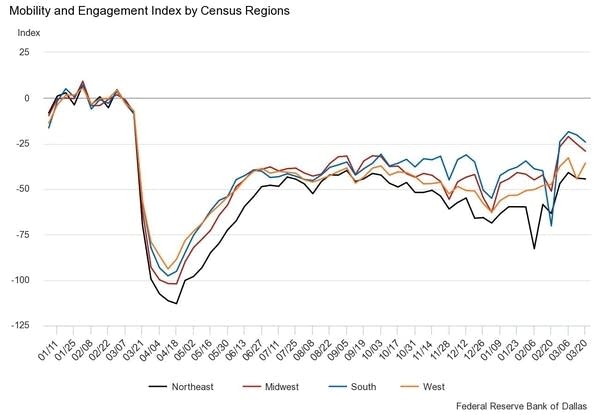
Using anonymized cellphone location data from a company called SafeGraph Inc., researchers at the Dallas Fed created the Mobility and Engagement Index to track movement.
“That’s also been very correlated with the swings in economic activity,” said Keith Phillips, an economist with the Dallas Fed.

The Centers for Disease Control and Prevention used SafeGraph’s foot traffic data to study how well stay-at-home orders work. The Federal Reserve Bank of New York used it to study the racial and income gap in pandemic commuting patterns. And it’s become closely watched by Wall Street analysts.
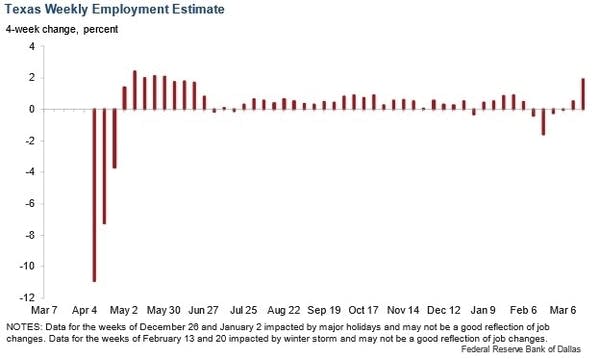
Phillips and his colleagues created a model based on several high-frequency inputs including the Mobility and Engagement Index, Homebase’s “hours worked” data, OpenTable’s reservation data, and credit/debit card transactions collected by a company called Affinity Solutions to forecast employment in Texas on a weekly basis.

“Normally, business cycles turn very gradually, kind of like a big barge,” Phillips said. “But when the economy changes like a speedboat instead of a barge, we have to rely on something to give us early estimates.”
Why high-frequency data isn’t going away
Some of the alternative indicators that came into widespread use during the pandemic have proved useful for tracking the economic impact of other kinds of crises.
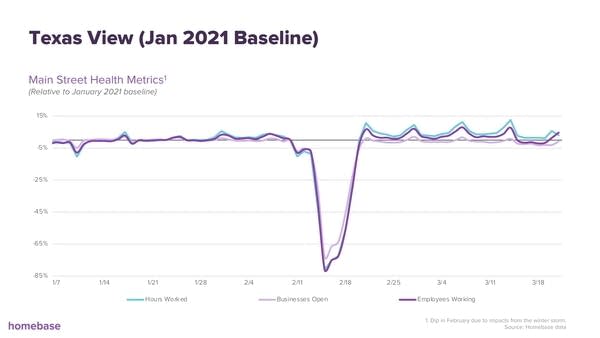
“A good example of that was the most recent winter storm that hit Texas very hard,” Phillips said. “Because we’ve been monitoring these weekly series due to COVID, we’re able to see that the storm’s impact was basically for a week.”
Damage from mid-February winter storms caused an estimated $130 billion in damage and economic losses in Texas alone, but high-frequency data they’d been tracking suggested that the effect on employment would be minimal.

“We didn’t know if that would be the case,” Phillips said. “But the week after the storm, you saw Homebase staffing levels returned back to where they were prior to the storm.”
High-frequency data gives people like Keith Phillips, his bosses at the Dallas Fed and policymakers in Washington, D.C., information about the economy faster.
“It’s not like policy changes based on daily data, but the sooner we know that there’s been a dramatic change or improvement, the better off we are,” Phillips said.


